3 eye-opening water maps for business
These powerful tools measure water footprints, help estimate business risks and can aid with disclosure efforts and life-cycle analysis. But they're friendly enough for curious amateurs, too. Read More
As climate change brings more frequent droughts and floods, understanding water usage and risks arguably has never been more critical. By most measures, the world is falling short of meeting United Nations Sustainable Development Goal No. 6: to achieve “sustainable water management and sanitation” by 2030.
Businesses have been using more water than ever in the past few years, even as they report more about water risks, according to the CDP’s Treading Water report, released Friday. Corporations reported $38 billion in losses related to water last year, the report found, examining data from nearly 800 companies. And physical risks relating to scarcity and poor quality of water make up three-quarters of reported risks, which can upset production, damage reputations and even cause a company to lose its license to operate. Yet 44 percent of companies surveyed by GreenBiz and Ecolab survey lack a plan to achieve water goals.
Nevertheless, the CDP maintains that Global Goal No. 6 is possible to meet: “To succeed, those companies that affect our freshwater must be put to work to protect it. The business risks of inaction are very real but so too are the opportunities lost.”
In order for companies to seize financial opportunities around water and meet the demands of the Global Goals — to stop polluting waterways, to increase water efficiency and to better manage freshwater resources overall — they need serious data. To that end, these powerful, free maps offer a big picture view for the layperson as well as a surprising level of detail and customization for water managers. While other proprietary, paid software exists, these tools from trusted NGOs are available to anyone with a web browser.
Just keep in mind not to use any map in isolation to make business decisions, CDP Director of Water Security Cate Lamb says. “Water risks are complex. You can’t map community perception of you as a business. You only get that from factory meetings, from people on the ground living in the community.”
Water Footprint Assessment Tool

The Water Footprint Network, based in the Netherlands, released this tool, which requires the Adobe Flash player, in 2017. Among the highlights: displays of water footprints per crop, industry, country or river basin. It even offers views of the sustainability of water footprints, filtered by certain criteria. Choose from green (related to rainwater), blue (groundwater and surface water), gray (related to wastewater) or total water data, and the map colors in accordingly.
Other options include bar-chart geographic assessments or pie charts per crop or sector. There’s even a production assessment of commodities per crop, sector or facility. Pick from more than 100 crops including fruit, vegetables, nuts and non-food crops.
Its superpower: Map out and save your company’s operational water footprint at the facility level (get those effluent and leakage numbers ready!) or explore the supply-chain water footprint of a commodity by nation. The bulk of the data comes from WaterStat, “the world’s most comprehensive water footprint database.” Power users can consult the manual (PDF) and explore how the tool can help unearth ways to reduce water footprints.
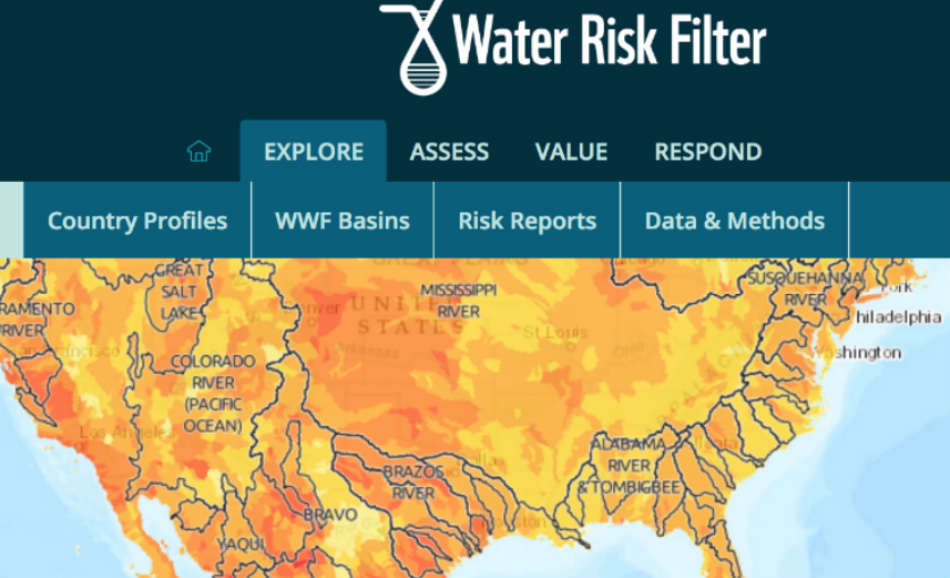
WWF Water Risk Filter

The WWF Water Risk Filter, originally released in 2012 by WWF and the German Development Finance Institution DEG, is on version 5.0 after an upgrade last year. “Designed to be easy to use by non-water experts, this is the only water risk tool to assess both basin and operational risks,” WWF says.
The filter offers four major sections — Explore, Assess, Value and Respond — accompanied by company profiles and scores of reports for additional research. “Explore” is available without a login, while the other sections offer various actions based upon the data you’ve entered.
The Maps under “Explore” dive deeply into risk. Select overall risks or drill down among some 30 options, including baseline water stress, corruption index or freshwater biodiversity richness. The map is also built to link your results entered from the “Assess” section to customized responses, “whether you want recommendations for one site, 10 sites or 1000 sites.”
Its superpower: “Respond” offers a customized set of “actions to mitigate your specific water risks” as well as a way to explore water-related opportunities, with tools “to convert risk to value and better understand how your financial statements may be impacts by water risk facing your assets.”
WRI Aqueduct Water Risk Atlas

The World Resources Institute maps water risks across the globe according to a handful of severity levels, from pale yellow to dark red. For more geographic detail, slide down the map transparency level, or select topographic, streets or other views.
The feature that allows users to choose a location is pretty sophisticated, beyond the usual zooming in and out. You can type an address, enter coordinates or import data from a spreadsheet. Copious choices are too numerous to list here; the Weighting Scheme dropdown alone offers Agriculture, Electric Power, Oil & Gas and Textiles and more. Regulatory and reputational risk options include Media Coverage, Access to Water and Threatened Amphibians. There’s even an option to color in a map by the quantity (such as groundwater stress) or quality (such as return flow ratio) of physical risks.
This map offers print-ready views of your own results that can easily be brought into a PowerPoint or elsewhere. The initial version came out in 2013, after Coca-Cola took the radical step of opening up its own proprietary data in 2011 for this purpose.
Its superpower: Feeling pessimistic, optimistic or in between? The Future Conditions section offers a glimpse at any of three years ahead — 2020, 2030 (Hello, SDGs!) or 2040 — based upon your desired outlook. Focus on projected water stress, supply, demand, or seasonal variability. Some of this data from Aqueduct is available on Bloomberg terminals for investors.
Honorable mentions

The U.S. Climate Resilience Toolkit offers this Water Resources Dashboard, a collection of maps for urban planners and water managers, which includes historical and current observations as well as forecasts of droughts, soil moisture conditions, extreme weather events and so on. (You’ll find hundreds of other tools there as well related to resilience in water, the built environment, food, energy, transportation and more.)
Esri’s ArcGIS Living Atlas of the World is a kind of “Facebook for Maps.” It collects maps in stunning detail, as well as 3D scenes, layers and tools for analyzing the underlying data. A search for “water” yields a seemingly endless scrolling list of maps. The Water Balance app, for instance, shows soil moisture, snowpack, precipitation, evapotranspiration, runoff and change in water storage since 2000. A couple more: USA Permitted Point Source Water Pollution and Aquaculture in U.S. Coastal and Offshore Marine Waters.