The stunning impact of COVID-19 social distancing on air pollution
How efforts to flatten the curve of COVID-19 have reflected air quality in the San Francisco Bay area. Read More
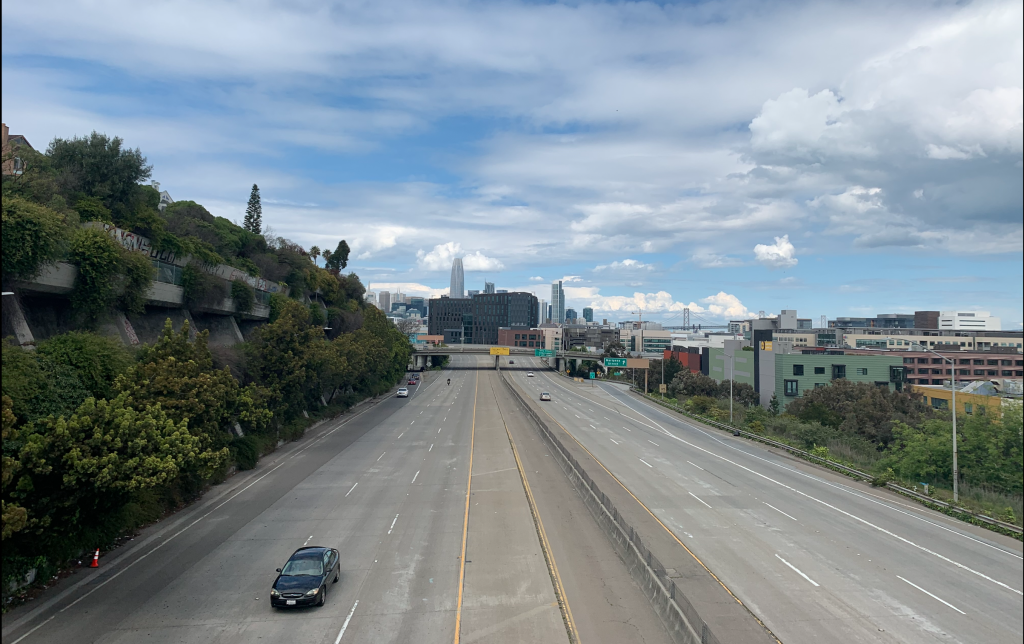
With millions of people sheltering in place across the San Francisco Bay Area, the daily ebb and flow of urban life has come to a sudden halt.
The COVID-19 pandemic has upended many patterns and placed tremendous strain on medical, economic, political and social systems. The corresponding drop in regional traffic, along with reduced industrial and commercial activity, also has led to a significant decline in air-polluting emissions. While images of empty freeways paint a surreal picture, they also give us an unprecedented glimpse into what happens to the air we breathe when we drastically and suddenly cut emissions.
This was certainly the case in China. Satellite images released by NASA and the European Space Agency that many have seen showed a significant reduction in nitrogen dioxide (NO2) in China from January to February.
While satellite-based measurements give us a bird’s eye view of pollution over a region, ground-based measurements help us understand the pollution people are experiencing at the street level. To see how Bay Area air quality is being affected by efforts to flatten the curve of COVID-19, we are analyzing data from Aclima’s hyperlocal network deployed across all nine Bay Area counties, along with complimentary air quality data sources. We start with a simple question: To what degree have air pollution levels changed in the Bay Area over the past two weeks? Over the next several weeks, we will continue to release insights and findings from our ongoing analysis.
Comparing current Bay Area air pollutant levels to years past
To better understand the impacts of our collective responses to COVID-19 on Bay Area air pollution, we took a closer look at NO2, fine particulate matter (PM2.5), ozone (O3), carbon monoxide (CO) and black carbon (BC) in the Bay Area as reported by the Air Quality and Meteorological Information System (AQMIS) for weekdays from March 9 to March 20, and compared them with the average AQMIS-reported weekday levels for the same time period from 2017, 2018 and 2019.

We focused on weekdays to highlight changes during the workweek when commuter and other commercial traffic would be most affected. Looking at year-over-year differences helps to control for the seasonality associated with air pollution levels. There was a notable decrease in the levels of these air pollutants measured during 2020 to those from 2017 through 2019, with the exception of O3. In fact, NO2, PM2.5, CO and BC levels were from 16 percent to 29 percent lower during the first two weeks of the regional COVID-19 response.
The ‘Weekend Effect’: As NOx goes down, ozone temporarily goes up
So what’s going on with O3? Most likely the decline in nitrogen dioxide levels triggered what atmospheric scientists have called “the Weekend Effect.” This phenomenon, observed by researchers from the University of California, Berkeley, and Lawrence Berkeley National Labs in 2009 in the Caldecott Tunnel, causes a temporary rise in ozone that typically occurs on weekends when NOx (NO2 and NO) levels decline due to less diesel truck traffic, among other things. In this current case, the O3 levels went up 11 percent as compared to the average levels for these weeks in the past three years.
At the same time that O3 went up, NO2 steadily declined starting in early March, when people started working from home. The figure below shows daily NO2 levels measured by regulatory stations in the Bay Area Air Quality Management District (BAAQMD) network overlayed by the average of all the data, with an 11 ppb or 56 percent reduction in levels between March 4 and March 19.

Aclima measures 10% drop in carbon dioxide across the Bay Area
As the COVID-19 response altered behaviors that generate emissions, toxic pollutants declined, especially those caused by driving in heavy traffic. At the same time, greenhouse gas emissions dropped. The Aclima mobile sensor network is actively measuring hyperlocal air pollutants and greenhouse gases in every county in the Bay Area, across a range of parameters including CO2. By averaging our block-by-block measurements at the county level from Feb. 6 to March 19, we can see the trend of CO2 declining in a pattern similar to NO2 starting in early March resulting in a 47 ppm, or 10 percent, decrease in CO2 levels.

For reference, here is a brief description of each of the six pollutants and greenhouse gases discussed here and their common sources:
- Ozone (O3) is formed when sunlight reacts with vehicle pollution and is a key component of smog as well as a greenhouse gas that contributes to climate change. Breathing ozone irritates your respiratory system and can reduce lung function, aggravate asthma and cause permanent lung damage over time.
- Carbon monoxide (CO) is a colorless, odorless gas released when fuels are burned. Most CO in urban areas comes from vehicles. When inhaled, carbon monoxide displaces oxygen in the blood and deprives the heart, brain and other vital organs of oxygen. High levels of CO typically are not found outdoors. It also reacts with other molecules in the atmosphere to create carbon dioxide, a greenhouse gas.
- Carbon dioxide (CO2) is the primary greenhouse gas resulting from fossil fuel combustion. CO2 doesn’t directly cause human harm when encountered outdoors. The primary health concern with CO2 is its role in climate change. The main sources of CO2 include transportation, electricity production and industry.
- Fine particulate matter (PM2.5) is emitted directly from a combustion source or formed in the atmosphere from complex chemical reactions. Fine particulate matter (PM2.5) is one of the primary pollutants public health officials care about because it is linked to asthma, lung cancer and deaths from cardiopulmonary diseases.
- Nitrogen dioxide (NO2) is a gaseous pollutant that is formed from fossil fuel combustion and is a key component of smog. Indoors, NO2 can be emitted from unvented gas appliances. NO2 irritates the respiratory system and can lead to coughing or wheezing, increased asthma attacks and reduced lung function.
- Black carbon (BC) refers to sooty black particles emitted from diesel engines, heavy oil or coal-fired power plants, biomass burning and other sources that burn fossil fuel. Black carbon is associated with health problems including respiratory and cardiovascular disease, cancer and even birth defects.
While this initial glimpse at the data shows a strong correlation between reduced levels of air pollutants and actions taken to flatten the curve of the COVID-19 pandemic, much more analysis is needed to better understand the interdependencies and variables driving these trendlines.
Over the coming weeks, we will continue to analyze and share relevant insights from Aclima’s hyperlocal mapping of air pollutant levels throughout all nine counties of the Bay Area, combined with additional and complementary data sources that shed light on the changes we’re seeing in these unprecedented times.
This article originally appeared on the Aclima corporate blog.